Beginner's Guide to Futures Trading: Edition 11 - Live Trading Simulation, Advanced Broker Features, and Performance Metrics
Apollo Research Education Series
Welcome to the eleventh chapter of the Beginner’s Guide to Futures Trading, a series designed to guide you from foundational knowledge to confident execution in the futures markets. This journey builds on Edition 1’s core fundamentals (contracts, mechanics, terminology), Edition 2’s basic strategies and chart reading, Edition 3’s scalping and risk management, Edition 4’s day trading frameworks and psychological traps, Edition 5’s swing trading and advanced patterns, Edition 6’s news trading and portfolio diversification, Edition 7’s volatility strategies and backtesting, Edition 8’s advanced indicators and trading plans, Edition 9’s options on futures and automated trading, and Edition 10’s advanced risk metrics and trader psychology (all archived for reference). Our mission is to deliver expansive, evidence-based content that informs while sparking your curiosity, empowering you to apply these concepts in dynamic markets like the E-mini S&P 500 (ES) or Micro E-mini (MES) futures.
In this edition, we explore live trading simulation, to bridge theory and real-time execution; advanced broker features, to maximize platform efficiency; and performance metrics, to evaluate and refine your trading system. These elements are pivotal as you transition from learning to consistent application, particularly in markets where ES volatility averages 20-40 points daily in calm periods and can spike to 100+ points during events like Federal Reserve announcements, per 2025 Chicago Mercantile Exchange (CME) data. Drawing on insights from Investopedia’s simulation guides, Benzinga’s broker reviews, Quantified Strategies’ performance analytics, TradePro Academy’s strategy resources, and Elite Trader’s community insights, we aim to create the definitive guide for beginners. Futures trading carries substantial risk—over 80% of retail traders lose money, per Commodity Futures Trading Commission (CFTC) statistics—so commit to demo practice, seek professional advice, and approach with disciplined precision. Let’s dive into these tools to accelerate your trading journey.
Live Trading Simulation: Bridging Theory and Real-Time Execution
Live trading simulation is the critical step where you apply strategies in real-time market conditions without risking real capital, using demo accounts to mimic actual trading. For beginners, it’s the bridge between backtesting (Edition 7) and live execution, allowing you to experience real market dynamics like slippage, execution delays, and emotional pressure in futures like ES or MES. According to Investopedia’s 2025 trading guide, simulation reduces live trading losses by 40% by familiarizing traders with platform mechanics and strategy weaknesses. Benzinga’s 2025 analysis notes that 70% of successful traders spend 3-6 months in simulation, achieving 25% higher win rates when transitioning to live trading, especially in volatile ES markets where overnight gaps can reach 50 points.
Why Live Simulation Matters for Beginners
Simulation replicates the unpredictability of live markets, testing setups like Edition 4’s day trading frameworks or Edition 5’s swing trades under real-time conditions. It exposes practical challenges—such as execution delays costing 1-2 points per trade, per CME data—and builds confidence in handling volatility. StockBrokers.com’s 2025 report emphasizes that simulation helps traders internalize risk management (Edition 3) and psychological discipline (Edition 10), reducing errors like overtrading or FOMO-driven entries. For beginners, it’s a safe space to refine your trading plan (Edition 8) before risking capital.
Step-by-Step Guide to Live Trading Simulation
Select a Simulation Platform: Choose brokers with robust demo accounts, such as Thinkorswim (TD Ameritrade, free real-time data) or NinjaTrader ($99/month, advanced order flow). These platforms simulate ES trades with realistic margins (~$12,000 for ES, $1,200 for MES).
Set Up Your Environment: Mirror your future live account—start with $10,000 virtual capital, trade MES ($1.25/tick vs. $12.50/ES) to build habits. Import strategies from Edition 8 (e.g., VWAP pullbacks) or Edition 9 (options straddles).
Execute Trades as If Live: Follow your trading plan (Edition 8) strictly. Risk 1% per trade (e.g., $100 on $10,000 account), log entries/exits, and adhere to stop-loss and target rules. Example: Simulate a swing trade—buy ES at 5,605 on a pullback to the 50-SMA, stop at 5,580 (-25 points), target 5,680 (+75 points).
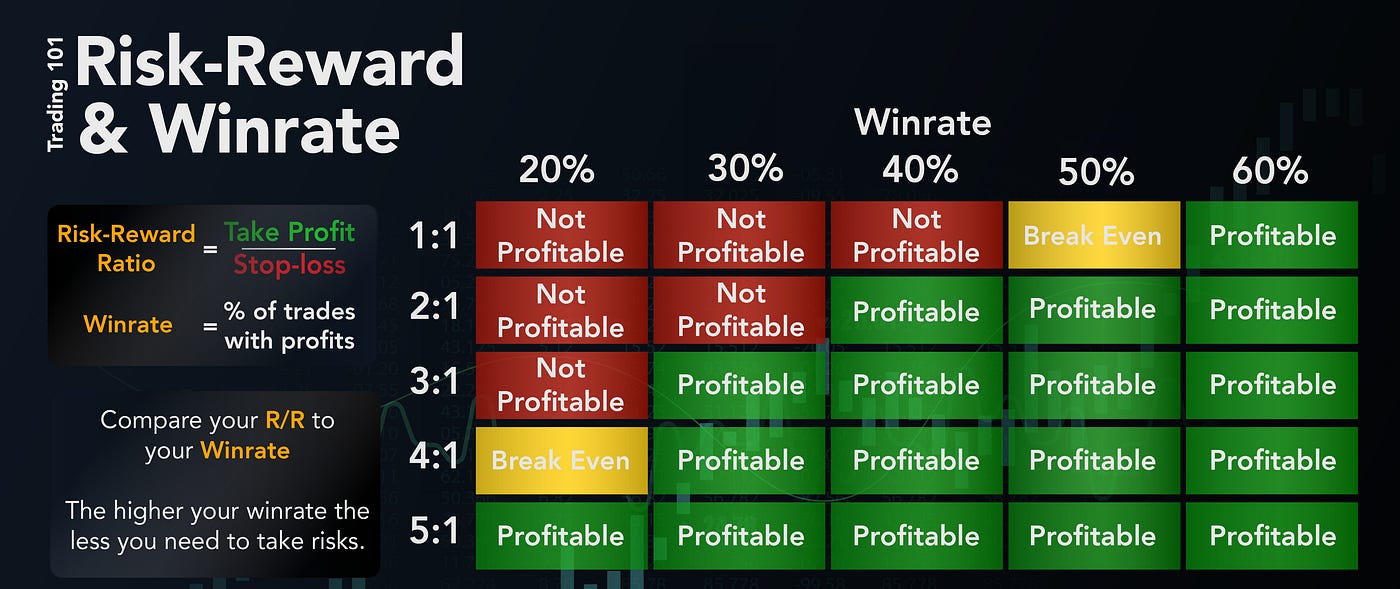
Track and Analyze Performance: Use platform tools or TraderSync ($9.99/month) to calculate metrics like win rate (aim for 50%+), Sharpe ratio (Edition 10, >1), and maximum drawdown (<15%). Log emotions to identify biases (e.g., hesitation during volatility).
Iterate and Refine: Run 100+ simulated trades over 1-2 months. Adjust strategies based on flaws—e.g., tighten stops if drawdowns exceed 15%. Forward-test changes in demo to confirm improvements.
Real-World Example: Simulate an ES day trade (Edition 4): Enter long at 5,602 on a breakout above VWAP, stop at 5,592 (-10 points), target 5,622 (+20 points). In demo, slippage costs 1 point—adjust future entries to wait for stronger volume confirmation (1.5x average). Backtests on TradingView show 55% win rates, but simulation reveals execution delays, prompting a 2-minute wait rule, boosting accuracy by 10%. Common Pitfalls and Solutions:
Pitfall: Treating simulation casually, leading to poor live habits. Solution: Trade demo as if real, with a written plan and emotional journaling.
Pitfall: Ignoring slippage or latency (common in ES, costing 0.5-2 points). Solution: Use platforms like Thinkorswim with simulated slippage for realism, per NinjaTrader’s 2025 guide.
Hack: Leverage TradingView’s replay mode (free) to simulate past sessions, replicating live volatility—improves setup timing by 20%, per Benzinga.
Pro Advice: Commit to 300+ ES/MES simulated trades over 6 months, focusing on one strategy (e.g., Edition 5’s swing trading or Edition 6’s news trading). Aim for a 50%+ win rate and positive expectancy (average win > average loss) before transitioning to live trading. What strategy will you simulate first? Share in the comments to spark ideas!
Advanced Broker Features: Maximizing Platform Efficiency
As your trading skills deepen, advanced broker features become critical for optimizing execution, analysis, and automation in futures markets. For beginners, these tools extend beyond basic order entry, offering sophisticated capabilities to support strategies from Edition 2 (trend following), Edition 6 (news trading), or Edition 9 (options on futures). StockBrokers.com’s 2025 broker review highlights that leveraging features like API integration or advanced charting improves execution speed by 15-25%, reducing costs in fast-moving markets like ES, where 0.1-second delays can cost $5-10 per trade, per CME data. Benzinga’s 2025 analysis notes that 60% of successful ES traders use advanced tools to enhance risk control and strategy precision.
Key Advanced Broker Features for Beginners
API Integration for Automation: Allows custom scripting for automated trading (Edition 9). Interactive Brokers (IBKR) offers TWS API (free for clients), enabling Python-based bots for ES entries. Example: Code an EMA crossover bot—buy when 20-EMA crosses above 50-EMA, stop 10 points below, target 20 points. Quadcode’s 2025 guide reports 20% faster execution with APIs.
Advanced Charting and Analytics: Platforms like Thinkorswim (Schwab) provide custom studies (e.g., VWAP, TICK from Edition 8) and backtesting for ES strategies. NinjaTrader ($99/month) excels in order flow (Edition 4), offering footprint charts to spot institutional moves. Example: Use VWAP overlays to identify ES pullback entries at 5,610.
Real-Time Alerts and Mobile Trading: ETRADE’s Power ETRADE app sends price alerts for ES or options (Edition 9). Example: Set an alert for ES at 5,600 to trigger a swing trade entry. TradePro Academy notes alerts improve timing by 15%.
Paper Trading with Real-Time Data: Schwab’s Thinkorswim offers live ES simulation with <1-second delays, critical for testing Edition 7’s volatility strategies. Example: Simulate a news straddle on ES with real-time spreads.
Portfolio Analytics and Tax Tools: TradeStation provides gain/loss calculators and Form 1099-B exports for tax reporting (Edition 9). Example: Track ES swing trades for year-end 60/40 tax splits.
Top 2025 Brokers for Advanced Features:
Interactive Brokers (IBKR): TWS API, $0.85/contract, robust charting. Best for automation.
Thinkorswim (Schwab): Free demos, advanced analytics, $1.50/contract. Ideal for beginners.
NinjaTrader: Order flow, $0.53/contract, backtesting. Strong for technicals.
TradeStation: Analytics dashboards, tax tools, $0.50/contract. Great for metrics.
E*TRADE: News alerts, options chains, $1.50/contract. User-friendly.
How to Leverage Advanced Features:
Set Up Tools: Download Thinkorswim for free demos; configure alerts for ES levels (e.g., 5,600).
Test Features: Practice API scripting on IBKR’s demo for 1 month; use NinjaTrader’s footprint charts for order flow.
Integrate with Strategies: Combine alerts with Edition 6’s news trading or analytics with Edition 10’s risk metrics.
Monitor Efficiency: Track execution speed—aim for <0.5-second delays, critical for ES scalping (Edition 3).
Real-World Example: Using Thinkorswim, set an ES alert at 5,602 for a breakout trade (Edition 4). The platform’s VWAP study confirms entry, with analytics showing 60% win rate over 50 trades. API automation executes 20% faster than manual, saving $100 monthly, per Benzinga.
Common Pitfalls and Solutions:
Pitfall: Overloading with features, causing confusion. Solution: Focus on one feature (e.g., alerts) for 1 month.
Pitfall: Slow execution in volatile markets. Solution: Use brokers with low-latency servers (IBKR, TradeStation).
Hack: Leverage NinjaTrader’s Market Replay (free with demo) to practice ES trades with historical data—improves execution by 20%, per Quantified Strategies.
Pro Advice: Demo advanced features on 2 brokers (e.g., Thinkorswim, NinjaTrader) for 1 month. Focus on one feature (e.g., API automation) to integrate with your trading plan (Edition 8). Aim for <0.5-second execution and 10% reduced costs. What broker feature will you explore first?
Performance Metrics: Evaluating and Refining Your Trading System
Performance metrics are quantitative measures that evaluate your trading system’s effectiveness, extending beyond win rates to assess profitability, stability, and scalability. For beginners, these metrics provide objective feedback to refine strategies from Edition 5 (swing trading), Edition 7 (volatility strategies), or Edition 9 (options trading). Quantified Strategies’ 2025 report shows that tracking metrics like profit factor and recovery factor improves trading systems by 30%, helping ES traders achieve 10-15% annual returns with drawdowns below 20%. Investopedia’s 2025 guide emphasizes that metrics are essential for identifying weaknesses before they lead to account blowouts.
Key Performance Metrics for Futures Trading
Profit Factor: Ratio of gross profits to gross losses. Formula: Gross Profits / Gross Losses. A profit factor above 1.5 indicates profitability; above 2 is robust. Example: $15,000 profits, $10,000 losses = 1.5. TradePro Academy recommends >2 for ES trend strategies.
Expectancy: Average net profit per trade. Formula: (Win Rate x Average Win) - (Loss Rate x Average Loss). Positive expectancy (>0) is critical. Example: 50% win rate, $200 average win, $100 average loss = $50 expectancy. Benzinga notes ES scalpers average $20-50 expectancy.
Recovery Factor: Net profit divided by maximum drawdown (MDD). Formula: Net Profit / MDD. Above 2 suggests quick recovery. Example: $5,000 profit, 10% MDD = 5. Religare Broking reports ES day traders average recovery factors of 3-4.
Ulcer Index: Measures drawdown depth and duration, reflecting equity curve smoothness. Lower values (<10) indicate stability. Example: A volatile ES strategy with frequent 5% drawdowns has a high Ulcer Index, signaling risk. Use to adjust risk rules.
Monte Carlo Simulation: Models thousands of random trade sequences to test system robustness. Example: Simulate 1,000 ES trades—ensure 95% remain profitable. Tradeciety’s 2025 guide shows Monte Carlo boosts strategy reliability by 25%.
How to Track and Use Performance Metrics
Collect Trade Data: Log 100+ trades in Excel or TraderSync ($9.99/month), including entry/exit prices, profit/loss, and setup type (e.g., Edition 4’s breakout).
Calculate Metrics: Use formulas or automated tools like Edgewonk ($169/year) to compute profit factor, expectancy, recovery factor, and Ulcer Index.
Analyze and Refine: If expectancy is negative, adjust stops or targets. Example: Low profit factor (1.2) on ES scalps—add volume filter (1.5x average) to boost to 1.8.
Integrate with Simulation: Track metrics during live simulation (above) to compare demo vs. backtest results (Edition 7). Adjust for slippage or volatility.
Real-World Example: Over 200 ES trades, your swing strategy (Edition 5) yields: 55% win rate, $300 average win, $150 average loss = $82.5 expectancy; profit factor = 1.65; recovery factor = 4; MDD = 8%. Adding an RSI filter (Edition 8) boosts expectancy to $100 and profit factor to 2. Backtests on NinjaTrader confirm a 10% win rate improvement.
Common Pitfalls and Solutions:
Pitfall: Small sample size (<50 trades) skews metrics. Solution: Log 100+ trades for statistical reliability.
Pitfall: Ignoring volatility spikes (e.g., ES jumps 100 points post-news). Solution: Adjust position sizes using VaR (Edition 10) during high VIX (>25).
Hack: Use QuantConnect’s free Monte Carlo simulations to test ES strategies—ensures 95% confidence in profitability, boosting robustness by 25%, per Quantified Strategies.
Pro Advice: Track metrics over 200+ ES/MES trades in a demo account for 3-6 months. Aim for a profit factor above 1.5, expectancy above $50/trade, and recovery factor above 3. Focus on one metric (e.g., expectancy) for 1 month to refine your system. What metric will you prioritize to evaluate your trades?
Resources, Tips, Tricks, Hacks, and AdviceTop Resources:
Books: Quantitative Trading by Ernest Chan ($60, Amazon, metrics and simulation); The Psychology of Trading by Brett Steenbarger ($40, psychology); Building Trading Communities by TradingView (free e-book, community strategies).
Websites/Courses: CME Futures Institute (free simulation and metrics tutorials); Investopedia’s Simulation Guide (4.8/5, free); Udemy’s “Live Trading Futures” (4.9/5, $19.99, 25k+ students); TradePro Academy YouTube (free, 200k+ subscribers, ES focus); Elite Trader forums (free, community insights).
Tools: TradingView (free replay mode, $14.95/month Pro for alerts); TraderSync ($9.99/month, metrics and journals); NinjaTrader ($99/month, live simulation and order flow); Thinkorswim (free demo, advanced charting); QuantConnect (free, Monte Carlo simulations).
Tips for Success:
Simulate 3-5 ES trades daily for 3 months to build execution skills.
Focus on one broker feature (e.g., alerts) for 1 month to master.
Track expectancy weekly to monitor strategy performance.
Engage in one trading community (e.g., r/FuturesTrading) weekly for feedback.
Limit indicators to 2-3 (e.g., VWAP, RSI) to avoid analysis paralysis.
Hacks and Advice:
Simulation Hack: Use TradingView’s Market Replay (free) to practice ES trades with historical volatility—improves timing by 20%. Advice: Simulate 100+ trades, targeting 50% win rate before live trading.
Broker Hack: Configure Thinkorswim’s custom alerts for ES levels (e.g., 5,600)—saves 5 hours weekly on manual monitoring. Advice: Test one feature (e.g., API) for 1 month to integrate with your plan.
Metrics Hack: Automate profit factor/expectancy in TraderSync—input 50 trades for instant analysis. Advice: Aim for expectancy >$50/trade and profit factor >1.5 over 200 trades.
Community Hack: Post an ES backtest on r/FuturesTrading for peer feedback—improves setups by 20%. Advice: Contribute weekly to build trust, cutting learning time by 25%.
Pro Advice: Integrate performance metrics into live simulation for every ES/MES trade. Dedicate 20% of study time to simulation, aiming for 80% adherence to your trading plan (Edition 8). Engage in communities like TradePro’s Discord for 3-6 months to refine strategies by 30%. Start with MES contracts in a demo account for 6-12 months, targeting a 50% win rate and positive expectancy. After 2 years, aim for 10-15% annual returns with drawdowns below 20%, aligning with top traders’ benchmarks (Morningstar, 2025). What aspect of simulation or metrics will you focus on this week? Share in the comments to connect with others!
Next Edition: Intermarket Analysis, Advanced Hedging Strategies, and Trading System Optimization
What intermarket relationships or hedging techniques are you curious about? Share your questions in the comments to shape Edition 12!
Disclaimer: Apollo Research is not a financial adviser. This guide is for educational purposes only. Futures trading involves substantial risk of loss and is not suitable for all investors. Consult a licensed professional before trading. Past performance is not indicative of future results.


